Simple Data Analytics for Insurance Brokers and Agencies

Szymon Zak
August 22, 2024

What Do Brokers and Agencies Need Analytics For?
There are two categories of metrics you are trying to understand:
- Metrics used to reduce operational inefficiencies and costs.
- Metrics used to generate more revenue – the recurring value comes from these!
Optimization-driven analyses
Maybe you don’t need analytics (yet). Let me explain…
…if your objective is to reduce costs or streamline your operations, you may opt for a self-made report. This is a viable option if all you are after is a single-time project. However, you are likely to need a more systemic approach to Business Intelligence when your organization grows, acquiring many agencies and gaining access to new core system installations.
Growth-driven analyses
This is not a one-time project. Business growth metrics are a recurring, changing thing that relies on hypotheses about: Lines of Business, geography, partners, clients, products, and income opportunities.
In this case, you should probably opt for some solution to stay relevant and be able to both see a top-view of your business as well as slice specific parts for more local analyses. Whether it’s going to be an industry-specific-package or a simpler project based on a data mart is really up to your scale, possibilities, and specific context.
You can manage perfectly fine with just a data mart and general solution for creating the BI layer e.g. Microsoft Power BI, Tableau, Qlik Sense, or Looker Studio.
Now, what makes practical and good (enough) analytics?

Accuracy, Timeliness, and Data Coverage
Perfect analytics sounds great in theory, but it’s not practical or necessary. Here’s what you need to know to get started.
Accuracy is important. Your data needs to describe correctly what it is meant to describe. A lot of that begins with good data entry, validation, stewardship, cleanup, and governance practices.
Timeliness matters. Fresh data is generally better, but some reports can tolerate a lag. Many companies will do just fine with reports coming every 2 to 4 weeks.
Data coverage. Do you need to see everything? While your analytics should aim to be close to reality, you don’t need total 100% analytics coverage. You need to keep it feasible, achievable, and practical.
Aiming for 80-85% of your business data is often sufficient to spot trends and make informed decisions. Consider diminishing returns. Would pursuing 90-95% data coverage produce enough value to at least earn break-even for the project hours invested?
All you need is good enough analytics to see trends and general direction to make accurate decisions. Seeing 80-85% of your business is sufficient to work.
There are also other data quality dimensions you may want to become familiar with if you are particularly interested in data management, or in charge of establishing a data governance program.
Let’s get to the more practical part. Maybe you could work with what you already have?
What About Using Your AMS for Insurance Analytics?
Wait – but wouldn’t it be possible to just stick to your core system for analytics? It could be…
…provided that your AMS offers (reliable) analytics capabilities – which they often do not. In all fairness, there could be good add-ons that enable you to extend the BI capabilities of your core system.
Technically, you could just run a book of business report or policy expiration report. But will they help you understand your business? Not exactly – because these work at the policy granularity, which means they won’t show you a top-view of your business. Stakeholders don’t want to miss the forest for the trees.
But let’s say you want to wrap it through spreadsheets anyway. You may be successful – in this case congratulations. You can absolutely run a reporting project every 2-4 weeks, and do well as a business.

Where AMS and Spreadsheets Fail
It’s a lot of manual work every time, and it may take you more time to change your course when something external happens in the industry. It may take you longer to validate the results of a serious business decision.
Let’s say you are willing to accept it at the stage where you are at.
What if you got two installations of a system from the same vendor, you can still reconcile two (or more) reports. Again, it takes time, and it gets slightly messier, but the tables look the same, so you’re good. Eventually, you will probably decide to get into analytics to save time and reduce complexity.
What if you get two installations of two different systems e.g. AMS360 and Applied Epic? Frankly? It’s painful to merge two reports that are built in a different way. You will definitely want to implement an analytics solution like Ennabl… or at least convert data from one system to another.
Should You Convert Data to Your Main Core System?
Brokers and agencies grow as they acquire other agencies. So, should you convert data from the acquired systems into your main AMS?
There is no right or wrong answer to that. Although our clients usually do convert data into their main AMS.
Before you go on, data conversion work is hard, and the task is complex. We talk at lenghts what data conversion specialists teams dela with.
- Read our post about data migration in insurance post-acquisitions, if you want to deeply understand the topic.
- Listen to ‘The Hidden Heroes of Insurance Data […]’ on The Insurtech Leadership podcast with our founder, Roman, hosted by Joshua R. Hollander, CEO of Horton International.
The Unseen Data Heroes of Insurance – Listen to Our Guest Episode
Our founder, Roman Stepanenko, shares insights into challenges of data administrators and data conversion teams in insurance.
Discover the gaps in the process, and the reality of manual workflows of insurance's data people. They are some of the most hard-working and unnoticed 'silent teams'.
Data conversion analysts, business systems analysts, implementation specialists, and data admins keep large brokers going after agency acquisitions.
What is in favor of converting?
- Consolidating data results with a centralized view of your business.
- Not having to deal with legacy systems or systems from vendors you are not familiar with.
- The main body of your company works on what your team already knows how to use.
- It may lead to optimized core system licensing costs or license per seat costs.
What is challenging about data conversion?
- Your acquired agency may find centralization hard, especially when you convert from
Applied Epic -> AMS360orAMS360 -> Applied Epicrather than fromAMS360 -> AMS360orApplied Epic -> Applied Epic. Changing a type of AMS system typically involves a lot of user re-training on a new system. - Data conversion is a huge endeavor which requires a specialized data conversion team, it’s not cheap, often comes with difficulties in hiring, the necessity to outsource, and various trade-offs.
- It will most likely involve your vendor’s professional services team, and custom-made scripts.
- It is terribly manual without proper tools, especially the data mapping part.
Even when you convert data, you still have to extract everything into a data mart to analyze it.

When Insurance Brokers May Need More Complex Analytics Solutions
There are merits to simpler data analytics approaches. At the same time, it’s important to acknowledge that there are situations where more complex, end-to-end solutions become beneficial for insurance brokers and agencies.
Let’s explore some scenarios where the transition to more sophisticated analytics might be warranted:
Growing Complexity of Operations
As your brokerage or agency expands, either through organic growth or acquisitions, you may find that your data needs become more intricate. There may come a point where simple methods may no longer suffice. More complex analytics solutions can help you manage and derive insights from larger, more diverse datasets across multiple branches or product lines.
Controlling Expenses on In-House Data Engineering and BI Development
You may be in a spot where you find your organization big enough to invest into better analytics while too small to plan for a roster of data engineering experts and analysts. You might as well be growing fast, giving more focus to expanding the returns-generating part of your business – think producers and sales enablement. It’s a business decision, maybe in under given conditions it’s more convenient to grab a solution off the market, get some customization, see quick benefits, and just keep moving.
Out-of-the-Box Capabilities for Data Enrichment
Your agency’s raw data alone may not provide the full picture needed for strategic decision-making past a certain point. This is where data enrichment capabilities become helpful. Standalone made-for-industry analytics often come with built-in features to enhance your existing data with additional context and insights.
Desire for Predictive Capabilities
While historical reporting is valuable, you might find yourself wanting to look forward. More advanced analytics solutions often include predictive modeling capabilities, allowing you to forecast trends, identify potential risks, and spot opportunities proactively. Although remember that forecasts are based on the past data. They only make assumptions about the future.
Let’s say you have resources, and you decided to go for homegrown analytics.
What should be your considerations?
Planning an Analytics Implementation Project in Insurance
Yes, it’s perfectly doable to implement homegrown, cost-effective analytics yourself.
Although be mindful of one factor able to heavily tip in-house project costs:
If you approach an analytics implementation project without clear answers and objectives then you risk running a horribly messy and expensive project.
- Define your
business objectives first, always. Who will useyour analytics?Who should be involvedin your project?- What exactly do you want to see?
- What
levels of granularitydo you need? - What are your
hypothesesyou want to find answers for?
Reminder: Analytics is Not Equal to Visualization
Analytics is not visualization. Visualization may facilitate understanding data and relationships, further putting it into context with data storytelling. Yet these are not prerequisites to making informed business decisions.
Great value can be delivered with just a simple spreadsheet. Excel with pivot tables, or a dashboard with elementary charts and filters may be enough.
Visualizations and data storytelling may help understand complex issues and influence the decision process. At the same time, the way data is presented may lead to unintended assumptions or skewed conclusions.
Remain critical when approaching charts and dashboards, and try to be aware that they influence your thinking. Availability heuristic (or availability bias) is a mental shortcut which leads you to frame your thinking around what is there in front of you.
We tend to assume that what we see is everything we are working with or need to make decisions! What you don’t see in your analytics may be equally important.
Remember that analytics and various models we use are based on deliberate choices. A different design decision can show you a slightly different world and give credit elsewhere. Any report will prioritize certain elements, filter out some data, and affect where your focus goes.
Now, the real question is how do you work towards accurate, reliable, and meaningful analytics.

How To Approach Building Homegrown Analytics in Insurance?
For most insurance brokers and bigger agencies there is no longer a single source of data that you would use to generate reports.
If you happen to have a single, reliable source of data that covers all your needs, all that you need to do is to get data out of that system, and pull it into a BI solution. Congratulations, you’re set.
Unfortunately, in most cases, your data won’t be available from just a single system.
Dealing with Insurance Data Coming from Disparate Systems
There are essnetially three scenarios:
- You may need
data of different classesfrom2 different kinds of systemse.g. financial accounting data and insurance policy systems. Imagine you are a broker who has a single AMS and needs to cross-check data with some financial system or Salesforce. - Your systems are
homogenousin terms of their type e.g. AMS, but they aredifferent installationsfrom the same vendor. - Your systems are of
the same type, again think AMS, but they come from different vendors. (As a matter of fact this is fairly similar to the first scenario due to differences in data structures.)
Let’s say you may have several installations of Agency Management Systems either from a single vendor, or from various vendors.
Your challenge is not so much in moving the data. There are solutions provided by the vendors themselves or available off the market that will copy your database into your data mart. We are not going into that – and usally this is not an issue at all.
You usually end up in a situation where your data from different sources ends up in a single data mart.
But you need to make a data architecture design choice.
What It Means for Your Data Mart
Within that data mart you have two approaches to designing your data:
1. Keep Original Data Schema and Replicate Everything
You replicate the original schema (somewhat simplistically, the underlying structure of data) of each input system and only add a column to each table indicating the system the data come from.
By the way, this is called a full-scale database replication.
- You have everything you need in the granularity of the original system.
- This means that you get every table and column.
- The only thing you would be adding would be adding a
source ID, to indicate from which system and its installation specific records came from. - This may be an overkill if you are just looking to count your clients.
2. Opt for Standardized, Abstracted Data Schema
If you are looking to work on a smaller scale with focus on selected areas then you may decide to define standardized data schema within your data mart.
In your data mart you can already define some sort of unified data schema (if you had prior experience with your input systems and know what you are doing).
- You define an
abstracted schema, specifyingentities,attributes, andrelationships. As a result, you can get a client-and-system-independent carrier table. - Then you will be standardizing data from your various source systems into that independent table with its abstracted data structure.
- In essence, what is in your data mart gets decoupled from the data structure of your source systems. There’s a separation between data structures of your systems and how all that data ultimately gets represented in your data mart.
Both of these approaches have their applications, benefits, and drawbacks.
Now, while your data mart may vary in how your data is structured, in both cases you will still keep original values as they are. You will typically store key 75 from the original table as key 75 with its original name (because there are usually other things from other tables pointing to that specific key).
This is super important – and usually comes with an annoying result.
The Universal Data Challenge: Entity Resolution
So, regardless of the approach you choose for structuring your data mart, the values get preserved as they are in the original system.
Okay, so you just got data from your disparate systems into your data mart. Now, what happens at this stage when you try to run a report to group something by customer or carrier?
Most likely it will not work!
Both approaches to data mart architecture need to address the same issue. Since you draw data from multiple sources, most likely you will get many, many permutations of specific inputs (because each of the values coming from different sources will have their different key and name).
Free Book: Practical Guide to Implementing Entity Resolution
Interested in implementing an in-house record matching solution with your own development team without using any outside vendors or tools?
You end up with a list of values that is not so useful for analytical representation.
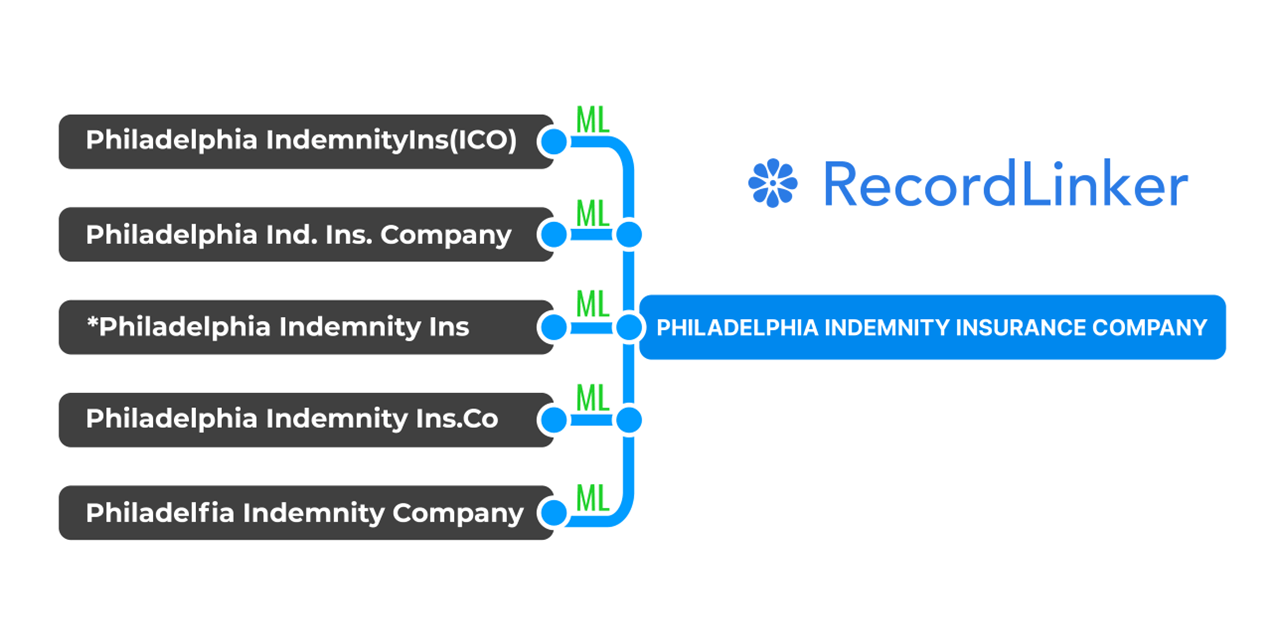
For example, many carriers and writing companies will appear throughout different systems, or even within a single system under different names.
Let’s take 'Philadelphia Indemnity Insurance Company':
- Philadelphia Insurance Co
- Phil Indemnity
- Phil Ind Insurance
- PIIC
- Philadelphia Indemnity Ins
- Philadelphia Indm Ins C
This is a reality of how Agency Management Systems are run and what consecutive agency acquisitions result with!
What do you typically do about this?
Someone calls Jane Doe, and says:
'Hey Jane, could you please standardize for each type of entity all these input original values to our standardized unified list of values.'
Entities are real world concepts/objects described by records and values. In data management, an entity is a sum of data of different records describing it. It is some sort of a whole, but if your records and values don’t point to the same entity then you cannot reliably describe/represent it as a whole.
Remember the example with Philadelphia Indemnity? So for each of these records someone has to add another column that maps these values under a common name or some sort of common ID.
This is a manual thing, and a horribly painful thing to do at that. It doesn’t sound scary considering just 5 variants, but think about sorting out 5,000 records… or doing this every week for various types of records in a big company that consistently grows.
Is there a different way to consolidate data for the purposes of insurance broker analytics?
Yes, you can use specialized Machine Learning, trained exactly for the task.
Can You Consolidate / Link Data with ML Yourself?
Okay, just for transparency – we are about to introduce RecordLinker®, our proprietary solution.
If you are looking to solve this problem yourself, look at this guide on approaching entity resolution (data linkage). It’s a good starting point. We want to be fair here.
At the same time, please, know that making a working, production-ready, user-friendly solution may take you 18-24 months.
This really plays against you, especially if you have just three months to standardize a data mart or complete 12 core system conversions – only with more to come shortly after.
Standardize Your Data Mart and Run Data Conversion Projects with Our ML
RecordLInker is made exactly for standardizing data marts as well as supporting agency, broker, wholesaler, and carrier core system data conversion projects. Our tool can standardize various types of data, including: carrier names, intermediaries, damage types, LOB, injury types, coverage types, and more!
RecordLinker integrates with Applied Epic and AMS360, and we can handle conversions between various core systems.
What you get:
- customizable and fast implementation
- at least 30% time saved on your data project timelines
- a data linkage solution used by some of the top 100 US P&C brokers
- the ML tool that eliminates tedious work in
data conversion teams - many, many more features and a user-friendly, quality-of-life-first tool
Auto-map your records during system migrations (e.g. writing companies and parents), identify wildly different spelling variants as a single entity, bulk-create missing companies and configure employees in your core system. Standardize entire data marts.
To learn more about how RecordLinker can help you improve the quality of your data, request a free demo!
Not sure whether we fit your use case? Just ask us (seriously)!
Suggested Reading About Data and Tech for Insurance Companies
Do you want to expand your knowledge about data management and innovating your insurance business? Building a data-driven organization requires effort, and knowledge of what’s possible. Check these articles to find more inspirations:
- Digital Transformation in Insurance
- Artificial Intelligence in Insurance: Navigating the Hype
- Linking Data in Excel: Could It Backfire?
- Types and Uses of Entity Resolution Software
- Data Conversion: Should You Keep It In-House or Outsource?
RecordLinker uses Machine Learning to make your data conversion painless. We easily handle conversion projects for systems like AMS360, Applied Epic, Sagitta, BenefitPoint, Guidewire, and more.
You can reliably cut conversion project times with ML from weeks to days!