KPIs Analytics: Making Sense of Multiple Data Sources
Roman Stepanenko
February 11, 2024
How many data sources are you dealing with? How do they relate to one another, and what specific challenges are making it difficult to get a clear, big-picture view? In this article, you’ll learn how to make sense of KPIs from different data sources.

Your KPIs are only as good as the data that informs them. But what happens when you have multiple data sources? How do you make sense of fragmented or contradictory data?
Studies have shown that integrating multiple data sets is a major challenge for companies aiming to become more data-driven.
Before looking into solutions, your first step should always be to examine your current data sources. This includes everything from financial records to social media metrics.
- How many data sources are you dealing with?
- How do they relate to one another?
- What specific challenges are making it difficult to get a clear, big-picture view?
Once you have mapped out your disparate data sources, it’s time to start thinking about how to best organize and track this information.
Fortunately, there is a range of specialized software solutions available to help you reconcile data from different sources and get a single, accurate view of your KPIs. In this article, we’ll explore three different types of software that can help break through the challenges of working with KPIs from different data sources.
Data Reconciliation Tools: Bring Your Data Into Line
Many organizations struggle with the inconsistent logging of data. For example, multiple teams may be recording information on customers, but using completely different terminology, methods, and software. How do you bring it all together? That’s where data reconciliation comes in.
Data reconciliation is the process of comparing data from different sources and identifying any discrepancies. This can be a valuable tool for enabling efficient KPI analysis, as it can help you to identify any errors or inaccuracies in your data.
There are a few different approaches you can take when reconciling data. One approach is to use a tool like Microsoft Excel to manually compare data sets. But unless your data sets are small and fairly simple, this process is extremely tedious and error-prone.
Another, more efficient, approach is to use a specialized data reconciliation tool. These tools can automate the process of data reconciliation, making it quicker, easier, and more accurate.
Usually, data reconciliation tools work by taking data from two different sources and matching them up. This can be done using a variety of criteria, such as matching based on ID numbers or names. Once the data has been matched, the data reconciliation tool will identify any discrepancies.
Of course, identifying discrepancies is only half the battle – you’ll have to go in and fix them in order to move forward. Fortunately, there are a few different ways to go about this.
You could edit the data in one of the sources so that it matches the other data. But if your data reconciliation tool has the right functionality, you can use it to automatically update the data in one of the sources – a much faster option.
Depending on the software, you may analyze and fix discrepancies in real time – useful for data types that need to be monitored closely, such as financial data – or in batches.
If you’re planning to invest in a data reconciliation tool, make sure you select one that is compatible with the range of data sources you’re using. You should also consider the number of sources you’ll need to draw from. Cheaper data reconciliation tools may only be able to handle two sources, but more robust software can usually handle several.
Data Visualization Tools: Analyze KPI Progress Holistically
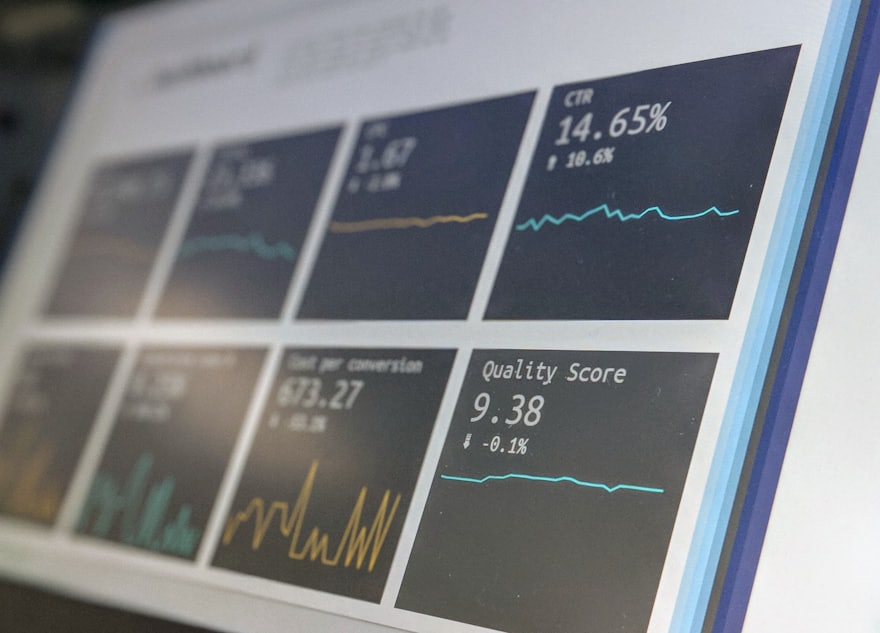
A data visualization tool allows you to create a dashboard of all your KPIs. By visualizing the data, you can often see patterns that you wouldn’t be able to discern by looking at the raw data.
This can be especially helpful when you’re trying to identify trends. It can also help you see which KPIs are in line with each other and which ones are out of sync. Many of these tools – Tableau, Looker Studio, Microsoft Power BI, to name a few – are able to draw different data sources into a single view.
Additionally, most data visualization tools will allow you to filter your data by time period, which is essential for comparing KPIs. For example, you may want to see how your KPIs have changed over the last month, quarter or year.
To use a data visualization tool effectively, you’ll need to have your KPIs organized into different categories. For example, you may have a category for marketing KPIs, sales KPIs, and financial KPIs. This will help you quickly identify which KPIs are performing well and which ones need improvement.
Once you have your KPIs organized, you can start creating your dashboard. Simply add the KPIs you want to track and arrange them in a way that makes sense to you. Many data visualization tools allow you to create custom reports, which can be extremely helpful when you’re trying to make sense of a large amount of data.
If you’re not sure where to start, there are plenty of tutorials and guides available online, including courses and professional certificates from known brands like Google and Microsoft. And, if you get stuck, there are always experts who can help you make sense of your data.
A limitation of data visualization tools is that they can only show you what’s happening in your data. They can’t tell you why it’s happening. For that, you’ll need to use other data analysis tools. Still, data visualization tools are a great way to get a quick overview of your KPIs and to identify which ones need further investigation.
Data Mining Tools: View Patterns and Relationships in Data
Data mining tools can help identify patterns in data sets; for example, cause-and-effect relationships.
They work by extracting data from sources, such as customer databases, and then applying algorithms to find patterns and relationships. The patterns and relationships can then be used to create models that can be used to make predictions or recommendations.
Data mining tools can work wonders for businesses aiming to analyze KPIs from multiple data sources. By extracting data from various sources and applying algorithms, businesses can identify factors impacting KPIs. This understanding can then be used to improve decision-making and even refining KPIs themselves.
If you’re considering investing in a data mining tool, it’s important to choose one that offers the features and functionality you need. Some important factors to consider include the size of the data sets you need to process, the types of algorithms you need, and the level of support you require.
Generally speaking, data mining tools can be divided into two main categories: commercial off-the-shelf (COTS) tools and open-source tools. COTS tools are usually more expensive than open-source tools, but they offer a number of advantages, such as easier installation and configuration, better support, and more user-friendly interfaces.
Open-source tools, on the other hand, are often free and offer a wider range of features, but they can usually require specialized skills to use, and may not offer as much support.
If your chief goal is to gain a holistic view of your KPI progress, you may want to consider a tool that offers data visualization capabilities. On the other hand, if you’re more interested in analyzing specific data sets, you may want a tool that offers more advanced features, such as predictive modeling.
Finally, it’s worth bearing in mind that data mining is not a silver bullet. As with data visualization and reconciliation tools, data mining can help you see what’s happening – but to really help your business, you should always be focused on the “why?” of what you’re seeing.
It can be tempting to answer this question with easy assumptions. But be wary of falling into this trap uncritically. Try to use other methods, such as qualitative research, to complement the insights you gain from data mining.
Master Data Management: Consider Modern Foundations
Putting tools directly on top of your disparate data sources is not necessarily a scalable, maintainable, long-term solution. You may handle data integration, cleansing, normalization, security, and governance at a foundational level in your organization.
Master Data Management deals with creating a system of rules and processes ensuring uniform, coherent, and accurate data ready for reliable organization-wide use. MDM takes data from different sources to create a single source of truth, a set of master records (or golden records), esuring that data is properly identified, cleansed, and enriched. It can help you in creating an environment, a data mart consolidating data points from multiple sources to enable informed business decisions.
A functional MDM will serve as a strong and dependable foundation for advanced Business Intelligence. The amount of preparatory work an MDM pipeline handles by preparing, organizing, and linking your data will reduce the necessity for linking, cleansing, and transforming data directly in data vizualization software. It limits the amount of layers of analytics-sided workarounds and manual data preparation in BI tools.
Master Data Management in itself is a broad, strategic topic. Here’s a list useful articles from our blog:
- 3 Essential Master Data Management Principles For Every Business
- Master Data Management Patterns: 5 Key Components
- Select The Right MDM Framework For Your Organization
- MDM Implementation: Best Practices
- Automatic Master Data Management
- Machine Learning in MDM For Improving Data
- Optimizing Your ERP’s Master Data For Better Performance
Tips for Analyzing KPI Data
Embracing the data-driven path in the organization requires maturity, scepticism, and curiosity. You need to know how your metrics and systems that report them work. They may present a skewed, general, or incomplete view – by design or due to technical limitations. More isn’t always better or optimal, less isn’t bad by default either.
Remember that data analysis is about asking the right questions. Here are some issues to consider:
- Are your reports understandable and useful to people using them?
- Do you need so much data? Can you select fewer metrics without sacrificing accuracy?
- Are you measuring effectiveness (lift, incrementality) or efficiency (“cost per”, ROAS, and various low-level performance metrics like click-through rate)?
- What causes shifts in data? A decrease isn’t necessarily bad if you can tie it to rise in relevancy and quality e.g. in SEO results.
- How is attribution shaping your perspective? What gets attributed? Does attribution inflate your metrics or lead to underreporting? You need to know how ad systems work and often trick you.
- Are you really measuring what you want to measure? Have you chosen the right metrics at the right level?
- How your different data points cross-sect and influence each other? Could it be that something seemingly underperforming supports the end results or contributes to another channel?
- Should you get rid of products that sell at low margins… even if they bring in new customers?
- What gets lost in metrics based on averages? Can you segment data further to draw conclusions? What would an analysis of outlier cases reveal? Conclusions drawn from global averages may mislead you.
Data analytics requires building consistent, organized, and well-designed reporting. At the same time, every analyst and stakeholder needs to be flexible with their data analysis. As soon as you start pulling levers in response to changing metrics without investigating what’s happening under the surface, or never make effort to reflect on goals themselves – you set yourself for a long-term failure.
Analytics Supporting KPIs In Summary

Software tools such as data reconciliation, visualization, and mining programs can be invaluable in helping you understand your KPIs across different data sources.
Just keep in mind that no software is a substitute for careful, thoughtful analysis and clear communication. The key is to use all available resources to get the most accurate picture possible of what’s going on in your business.
Above all, don’t get overwhelmed by the data. Keep your focus on the big picture, and let the data guide you to the areas that need further investigation. With a solid strategy behind you, multiple data sources will no longer be a barrier to a clear picture of your business and informed, constructive decision-making.
RecordLinker uses Machine Learning to normalize records across your data systems!
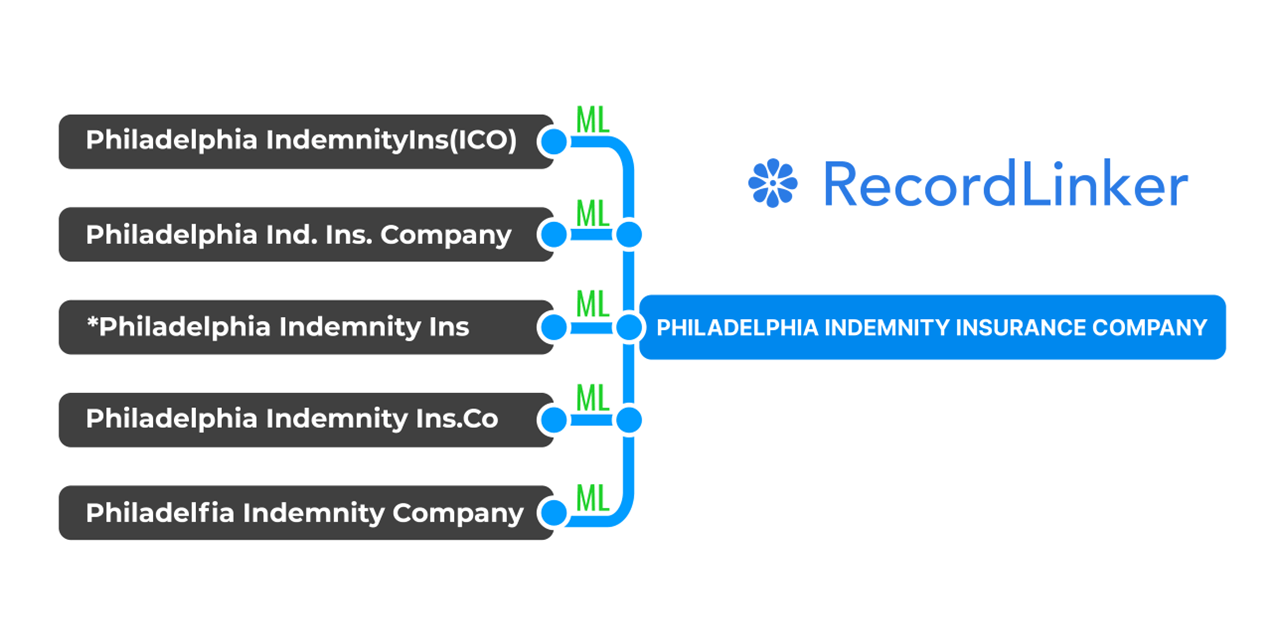
Interested in improving the quality of your data, but don’t have the time or resources to create a master data management program from the ground-up? RecordLinker is here to help. Our data integration and management platform can quickly connect your disparate data sources, identify and deduplicate records, and keep your data clean and up-to-date.
To learn more about how RecordLinker can help you improve the quality of your data, request a free demo!