Discovering Insights in Data: Cleaning Techniques and Data Normalization Rules
Roman Stepanenko
March 29, 2023
Wealth of available data and its exponential growth brings the challenge of extracting actionable insights. Data cleaning and normalization are crucial steps in the process of ensuring that the data is accurate, consistent, reliable, and ready for analysis..
Ready to unlock valuable data insights? Learn how to identify and correct inaccuracies and inconsistencies in your data to drive informed decision-making!

As organizations large and small take a keener interest in data-driven decision-making, they are collecting greater amounts of information than ever before. However, inaccurate, out-of-date, or misleading data can do more harm than good. A study of B2B businesses showed that on average, “dirty” data causes 40% of company objectives to fail.
You could be sitting before a vault full of promising business directions. But if your data isn’t clean, you are far from making use of it. How do you even begin the process that will let you discover data insights?
In this article, we’ll discuss how to approach cleansing and normalizing your data in a way that is efficient and effective.
But wait – have you considered using Excel?
Use Excel and Be Done? Please, Don’t Do That
This needs to be articulated clearly: Excel is not designed for scalable data linkage and cleansing.
It’s a very rigid software meant for calculations, which makes most of the available options for data transformation a rigid, deterministic, rule-based approach.

Where To Start Improving Quality of Your Data?
Before getting started, spend a good amount of time thinking through your data management objectives and how they relate to data quality.
Remember, this is a process, it’s not a one-off cleanup you should be pulling when your data deteriorates past critical point. Having a healthy data culture, proper data stewardship practices in place, as well as dedicated specialists dealing with data governance and day-to-day data management sets you up for stable data quality.
1. Identify The Data Sources
If your organization is like most, you have data scattered across a variety of different systems. This can make it difficult to get a complete and accurate picture of your business.
To cleanse your data, you need to first identify all of the data sources. This includes everything from customer databases, financial systems, supplier databases, warehousing systems, ERPs to social media and web analytics.
Create a map of all the data sources in your organization. This will help you to understand where the data is coming from and how it flows between different systems. Include information on who owns the data, who is responsible for maintaining it, and how often it is updated.
2. Identify The Data Types and Domains
As you map out your data sources, be sure to consider the types of data featured in each system. Data “types” can broadly be classified into a few categories:
- Categorical – data that can be placed into categories, such as gender, product type, or geographic region
- Continuous – data that can take on any value within a range, such as temperature, sales volume, or latitude
- Discrete – data that can only take on certain values, such as whole numbers or dates
- Text – data that comprises complete sentences or other free-form text
Also, think about data domains – these are overarching categories of data you are working with, describing groups of records about something specific: products, damage types, transactional data, customers, employees etc.
Remember, you don’t have to cleanse and normalize everything. For a starting point, choosing just what you need, may be the optimal approach.
3. Consider a Central Hub for Your Data
Now, if you want to link your data between disparate systems and perform entity resolution (join records describing a specific thing under a common umbrella e.g. customer profiles), you need two things.
- A canonical record set – a blueprint for names you want to standardize your linked data to and attrbutes they should contain, your golden records.
- A place to feed that data into. Typically a data warehouse or a more specialized data mart. (Read more about the canonical model in data architecture.)
4. Create a System of Rules
Once you’ve identified the types of data in each system, you can better understand how the data should be cleansed and normalized. Together with your data governance team (or, the internal stakeholders who create and use the data), you will need to decide on rules for how each data type should be formatted.
For instance, categorical data may need to be consolidated into a smaller number of categories. You might decide that continuous data should always be rounded to a certain number of decimal places. Discrete data may need to be converted into a different format (e.g., instead of “MM/DD/YYYY” you may choose to use “YYYY-MM-DD”). Finally, text data may need to have certain words removed, reordered, or appended.
When making decisions about rules, be as specific as possible. Vague rules may be difficult to implement and can often result in data that is not truly clean.
5. Find The Right Tools
Now that you’ve agreed on your data logging standards, it’s time to put them into practice. This is typically done through some kind of automated process, such as a script or software program.
Some organizations attempt to manually cleanse and normalize their data, but this is generally not feasible for large or complex data sets. Not only is it time-consuming, but it’s also prone to error.
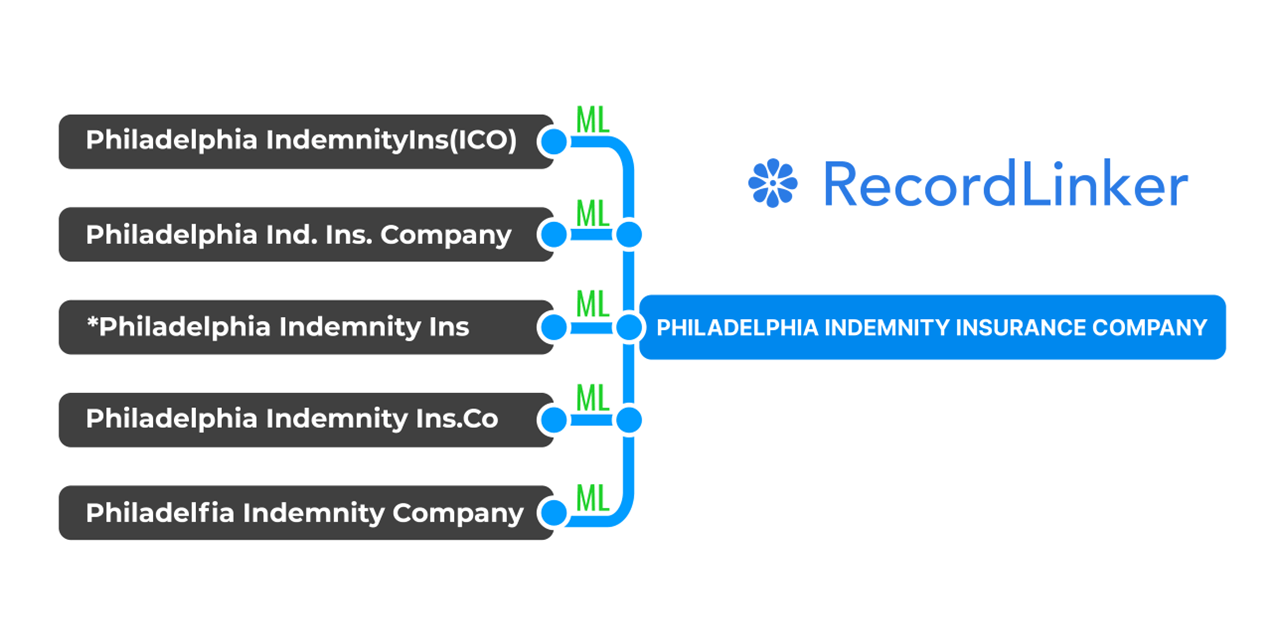
If you need a scalable, flexible way to normalize and link you data, Machine-Learning-based solutions are the way to go. The advantage that they give is that they are not constricted by deterministic rules.
Instead, they assess their choices based on confidence thresholds, and with time progressively become better as they learn off completed tasks. They are capable not only of finding and flagging errors, but also of suggesting corrections, matching records, and giving you options to approve changes.
You may try developing an ML-solution yourself, or use one of the commercially available solutions.
As you compare options, consider the following factors:
Amount and Type of Data
Some data cleansing and normalization software is limited as to the quantity, types, and sources of data it can work with, so read the specs carefully.
User-Friendliness
Your software’s interface should be easy to learn and use. Before settling on an option, be sure to consult the team members who will actually be using the tool. Have them watch a demo of the software and share feedback.
Cadence
Do you need 24/7 access to reliable, up-to-date data? Or would daily or weekly cleanses suffice? Some higher-end data cleansing software works in real time, while other programs process data in scheduled batches.
Scalability
Your software should be able to grow with you. If you’re anticipating increasing the volume of data you collect, adding new users, or expanding to additional data types, make sure the program will be flexible.
Customer support
Any software that handles your data should have a reliable customer support team behind it, just in case anything goes wrong. Before purchasing, get in touch with a rep to gauge how supportive and accommodating they would be.
Understanding Data Cleansing Techniques
Keeping your data clean takes a strategic, long-term mindset.
Data cleaning is the fundamental process of identifying and rectifying errors, inconsistencies, and inaccuracies within datasets. It involves several techniques, including:
1. Removing Duplicates
Duplicates are identical records that appear more than once in a dataset, leading to redundancy and potential inaccuracies in analysis. To address this, data cleaning involves identifying and removing duplicate records. By eliminating duplicates, you ensure that each record is unique and contributes meaningfully to the analysis.
2. Handling Missing Values
Missing or null values are common in datasets and can arise due to various reasons such as data entry errors or incomplete information. Handling missing values is crucial to maintain data completeness and accuracy. Data cleaning techniques involve strategies such as imputation, where missing values are replaced with estimated or calculated values, or deletion, where records with missing values are removed from the dataset.
3. Correcting Errors
Errors in data can occur in various forms, including typos, formatting inconsistencies, or inaccurate values. Data cleaning involves identifying and rectifying these errors to ensure data integrity. Techniques such as data validation and data profiling are used to identify errors and anomalies in the dataset, followed by corrective measures such as data standardization or error correction algorithms.
4. Standardizing Formats
Data formats and conventions may vary across different sources or systems, leading to inconsistencies and challenges in data analysis. Standardizing formats involves ensuring uniformity in data representation, making it easier to compare and analyze data. Techniques such as data formatting rules or data transformation scripts are used to standardize formats and conventions across the dataset.
5. Data Consistency Constraints
Data consistency checks ensure that data adheres to predefined rules or constraints. For example, in a dataset containing age information, a consistency check may flag any entries that indicate an age outside a realistic range (e.g., negative age values or ages over 150 years old).
6. Outlier Detection and Treatment
Outliers are data points that significantly deviate from the rest of the dataset. These can skew analysis results and lead to inaccurate conclusions. Data cleaning involves detecting outliers using statistical methods and then either correcting them or removing them from the dataset.

Exploring Data Normalization Techniques
Data normalization is a critical aspect of data management that focuses on structuring data to reduce redundancy and improve consistency. Let’s delve into key techniques used in data normalization:
1. Record-Level Normalization
Record-level normalization is like arranging files in a filing cabinet. In a cluttered office, documents may be scattered or duplicated, making it challenging to locate specific information efficiently. Similarly, within a dataset, without normalization, individual records may contain redundant or overlapping data, leading to confusion and inefficiency.
By normalizing records, we tidy up the data, ensuring that each record contains unique and non-redundant information. Record-level normalization facilitates efficient data storage and retrieval in databases. This organized approach enhances data integrity and usability, streamlining operations and improving decision-making processes.
2. Entity-Relationship Modeling
Entity-relationship modeling is like drawing a map of connections between different pieces of information in a dataset. We’re mapping out relationships between data entities, like customers and their orders.
Here’s how it works: Let’s say we have a database for an online store. We’d use entity-relationship modeling to define how customers relate to orders. Each customer can have many orders (one-to-many), but each order belongs to only one customer (one-to-one). By mapping out these relationships, we create a clear picture of how data is connected and organized. This helps us design a database that accurately reflects these relationships, making it easier to manage and analyze data effectively.
3. Schema Normalization
Schema normalization is about structuring data in a database so that it’s organized, efficient, and easy to use. Think of it like designing a blueprint for a house. The schema defines what types of data we have, how they’re related, and where they belong.
For example, if we’re storing information about customers and their orders, the schema would have separate sections for customers and orders, with specific details like names, addresses, and order numbers neatly organized. By normalizing the schema, we ensure that data is stored logically and consistently, making it easier to manage and retrieve when needed
By employing these data cleaning and normalization techniques, organizations can ensure that their data is accurate, reliable, and well-structured, laying a solid foundation for effective data analysis and decision-making.
Data Normalization Rules
Let’s think about essential principles for structuring and organizing data to enhance efficiency and reliability. Here are the key guiding practices of data normalization:
1. Eliminate Redundancy
A fundamental principle is to cut down on unnecessary repetition in data storage. Redundancy occurs when the same information is stored in multiple places, which can lead to inefficiencies and inconsistencies. By identifying common attributes and organizing them into separate tables, organizations can streamline these.
2. Ensure Atomicity
Atomicity ensures that each data attribute represents a single, indivisible piece of information. This means breaking down complex attributes into simpler, more manageable components. By doing so, we enhance data integrity and flexibility, making it easier to store and retrieve information efficiently.
3. Maintain Data Consistency
Consistency is key to ensuring that data remains accurate and reliable across various operations and transactions. By defining relationships between different data entities and enforcing integrity constraints, we ensure that data stays synchronized and coherent. This minimizes errors and discrepancies, contributing to a more reliable database.
4. Establish Relationships
Establishing connections between different data entities is crucial for building a coherent data structure. Whether it’s one-to-one, one-to-many, or many-to-many relationships, accurately representing these connections helps create a cohesive data set. This facilitates efficient data management and analysis, enabling organizations to derive valuable insights.
5. Optimize Data Structure
Optimizing the data structure is essential for maximizing performance and efficiency in data storage and retrieval. By minimizing redundancy and reducing anomalies, organizations can design data schemas and tables that support efficient storage, retrieval, and manipulation of data.
By following these principles, organizations can create a well-structured and efficient data storage that enhances data integrity, consistency, and usability. This sets the stage for effective data management, analysis, and decision-making, ultimately driving business success.
Barriers for Data Cleaning and Normalization
Despite the obvious benefits of data cleaning and normalization bring, businesses may encounter major challenges when trying to improve their approach to data. These include:
- Data silos – barriers to data integration and accessibility caused by lack of cross-sectionality between departments.
- Disparate data sources – diverse sources of data located in different systems that are not integrated, often using vastly different data formats.
- Legacy systems – compatibility issues with outdated systems and technologies, often preventing smooth integration.
- Point-to-point integrations – multiple systems exchanging data with one another and translating incoming data.
- Data governance issues – lack of clear responsibilities, poor culture around data. resistance to change.
By staying abreast of these trends and embracing emerging technologies, businesses can remain competitive and drive innovation in the data-driven era.

Discovering Data Insights: What To Do With Clean Data
Once your data has been cleaned and organized, it’s time to uncover valuable insights that can guide your business decisions. Cleansed and normalized data provides a solid foundation for analysis, making it easier to spot trends and patterns that may have previously been hidden.
- Set Clear Goals – before diving into your data, make sure you know what you’re looking for. Define clear objectives and questions you want to answer to guide your analysis. Beginning with questions lets you find answers and validate your hypotheses.
- Break Down Your Analyses – data analysis can be overwhelming, so divide it into manageable steps. Start with exploratory analysis to get a feel for the data, then dive deeper as needed.
- Play With Data Analytics – absolutely, you may take a free-exploration approach and look at data from different angles, checking for patterns without assumptions. Only when you find something, you may develop hypotheses for testing and confirming if what you found is true.
- Make Use of Insights – there’s nothing worse than doing all that work, implemeting tools, and performing analyses without taking actionable steps. Proper data analysis happens in cycles. You find insights, suggest changes, implement them, gather data, and repeat it over and over again. Remember to use your data for growth!
Let’s look at some applications.
1. Exploratory Data Analysis (EDA)
EDA helps you view the general picture and understand data structure, general trends, correlations, outliers, and anomalies. For example, if you run a retail store, EDA can show you when sales are highest, which products are most popular, and how customers behave over time. While EDA can involve some data visualization, it makes use of summary statistics, correlation analysis, and other statistic tools.
2. Data Visualization Software
Think of data visualization as turning your data into pictures. Charts, graphs, and dashboards make it easier to understand complex information at a glance. For instance, if you work in healthcare, visualizing patient outcomes can help you identify areas for improvement and make better decisions about resource allocation.
3. Predictive Modeling
Predictive modeling lets you can make educated guesses about future trends and outcomes. For example, if you run an e-commerce website, predictive modeling can help you forecast demand, spot seasonality, optimize inventory, and personalize marketing campaigns.
Example – What Data Insights Can Do?
Imagine you’re running a manufacturing company, and you’ve just cleaned up your data on stock, product info, vendors, and suppliers. As you dig into the data, you notice something interesting: stock levels tend to jump around a lot, especially when you’re launching new products or running promotions.
Further investigation shows that these ups and downs often line up with delays in getting shipments from certain vendors or partners. You also spot a trend: after big sales events, your stock levels sometimes dip way too low, causing missed sales opportunities.
So, you decide to dive deeper into the data to figure out what’s going on. By looking at past stock levels, product launches, vendor performance, and partner relationships, you start to see some patterns emerge.
For example, you find that delays in getting shipments from specific vendors often happen right when demand for certain products is spiking. That tells you there might be some room to improve how you work with those vendors on delivering certain item categories separately and possibly and adressing the order priority for products that drag everything down, to avoid running out of stock
You also notice that after big sales events, your stock levels sometimes drop too low too quickly. To fix that, you decide to try forecasting demand more accurately using past sales data and market trends. This way, you can make sure you have enough stock on hand to meet customer demand without overstocking.
By using these data insights, you’re able to make smarter decisions about your stock levels, improve how you work with vendors and partners, and keep your business running smoothly.

Data Insights, Cleansing, and Normalization Wrapped Up
Don’t let dirty data prevent your organization from becoming efficient and well-informed–or worse, allow it to mislead you. If you’re invested in collecting data, you should be putting just as much effort into making that data work for you.
Data cleansing and normalization is a crucial part of any data management strategy. By taking the time to understand your data and establish a set of rules for processing it, you can ensure that your data is clean, consistent, and ready for deeper analysis.
Cleaning and normalizing data is an ongoing process, not a one-time event. As your data changes over time, your rules will need to stay updated to reflect those changes.
If you haven’t done so already, creating a data governance body is a good way to ensure that data cleansing and normalization are given the attention they deserve.
A data governance body is typically responsible for establishing and enforcing data quality standards, such as rules for cleansing and normalizing data. By making data governance part of your organization, you can ensure that data quality is given the attention it needs to deliver insights that are accurate, reliable, and actionable.
Recommended Reading About Data Quality and MDM
Check our recommended reading list for resources to help you understand various concepts of data management, find solutions, and ways of organizing your data management.
- KPIs Analytics: Consolidating Multiple Data Sources
- 5 Key Components of Master Data Management
- Master Data Management Implementation: Best Practices
- Data Linkage in Customer Data Integration
- [Guide] Building Your Own Record Linkage Solution
- MDM and Machine Learning For Improved Data
- Data Migration: Best Practices For A Smooth Transition
Interested in improving the quality of your data, but don’t have the time or resources to create a master data management program from the ground-up?
RecordLinker is here to help. Our data integration and management platform can quickly connect your disparate data sources, identify and deduplicate records, and keep your data clean and up-to-date.